Designing Visualizations for Cyber Security

Designing meaningful, intuitive, and appropriate visualizations of increasingly complex networks is no easy feat. Cyber security is a compelling example as it often deals with large volumes of data with varying quality from multiple sources [1]. While data processing can be left to machines, in-depth exploration, interpretation, and decision-making relies heavily on the expertise of human operators.
Visual interfaces and situational awareness
Visual interfaces play a pivotal role in bridging cyber defenders and cyberspace taking advantage of computers' rapid computational power and humans' perceptive abilities [4]. Cyber defenders depend on these interfaces to gain situational awareness, i.e. knowledge and understanding of the system status quo and its future status. “Good” visualizations aid cyber security defenders in recognizing complex patterns, detecting and preventing threats and vulnerabilities, interacting with the system, and deciding upon appropriate actions. In comparison, visualizations that are too complex, hard to navigate, or don't support the users' goals, quickly lose their value.
Security visualization is concerned with the use of perception to recognize and amplify cognitive activities. If data are represented in a way that does not comply with the inherent rules of the human visual system, the underlying patterns and trends of the data would not be detectable. [5]
Traditional visualizations are designed in a way that favors either the strength of computers or their human operators [4]. The early days of cyber security were centered around hardware and software design with little regard for human users [1]. Fortunately, this trend is changing with human factors gaining increasing attention, and rightfully so.
What to keep in mind when designing visualizations
While it might be tempting to start the design process by picking a visually pleasing model (who doesn't love the full-specked, dark-mode screens of movie cyber villains) several issues must be addressed to produce a valuable design. Some of these have been highlighted by Shiravi, Shiravi, and Ghorbani (2012):
-
Situational awareness - is the ultimate goal of conventional visualization systems aiming to provide a high-level view of security events, often through automated processes. It is related to the system’s capability in conducting real-time analysis, which requires extensive resources.
-
User experience - is just as important as the technical implementation. Many existing visualizations fail to address the focal points of UX, and therefore fall through in real-life applications, despite their potential.
-
Scalability - which concerns the growth in the amount of data has led to issues in conventional visualization techniques. With limited processing power, one must consider how security events can be intelligently preprocessed, filtered, transformed, and statistically summarized.
-
Occlusion - occurs when trying to visualize every aspect of a data prior to processing or filtering. This decreases the power of the visualization. Interactive techniques on both the data and visual levels are necessary to help understand complex visualizations.
-
Visualization techniques - encompass an array of decisions, including what visualization to use, colors, glyphs, or 3D/2D formats. Classic graph visualizations have long been the go-to method to represent network data. Still, they face limitations when dealing with large and complex networks - nobody likes hairballs! The search for alternative methods has led to the exploration of other options like chord diagrams, histograms, heat maps, and hive plots.
-
Preserving privacy - should also be given thought as security systems often gather and analyze insights on user behavior. Here one must find an acceptable balance between the collection of data and what is needed to provide secure and efficient services.
-
Evaluation - is required to prove that visualizations for cyber security indeed are capable of representing correlations of events, and can be used to identify irregularities and breaches. This includes both evaluation of the technical aspects, as well as user studies on actual user performance.
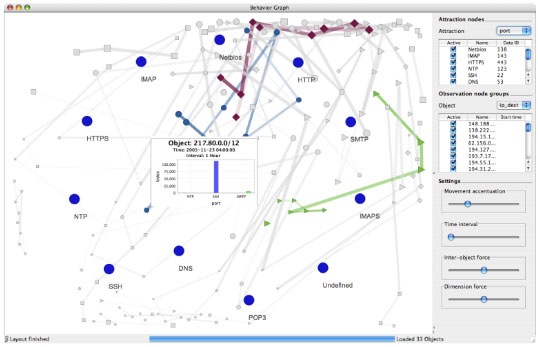
Image 1: Visualization of host behavior of 33 prefixes over a timespan of 1 hour [3]
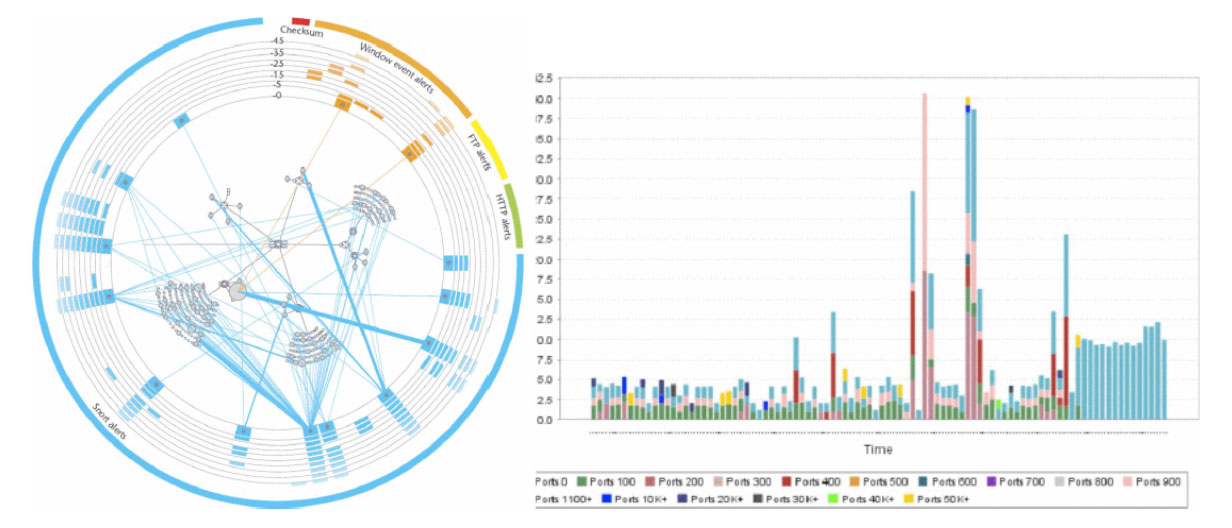
Image 2: More examples of visualizations for network security as summarized in [5]. 1) Vizalert, a visualization paradigm for network intrusion detection 2) Botnert traffic capture display using a histogram
Guidelines for cyber security visualization design
As summarized above there is a lot to keep in mind when designing for cyber security visualization. A general rule of thumb is adhering to the “overview first, details on demand” principle that has grown from the need to preserve interaction speed [1]. That being said, the overview should strive to answer the user’s most common questions by default.
With human factors in mind, Seong, Nuamah, and Yi (2020) have proposed four guidelines for designing cybersecurity visualizations. While far from exhaustive, they are a great starting point:
- Carry out work domain analyses: familiarize with the work domain before analyzing what the users (cyber defenders) do or know.
- Represent affordances of the work domain in a way that is compatible with human visual capabilities: the success of visualizations depends on the extent it encodes information in a way that human eyes can discern and human brains understand.
- Support the level of cognitive control at which cyber defenders choose to perform: visualizations should support all activities that cyber defenders must engage in, without making the tasks more complex.
- Provide interface resources that allow cyber defenders to navigate through the work domain: Take advantage of the human visual system’s ability to do preattentive processing. Visualizations should allow the cyber defender to understand the situation effortlessly, and identify patterns speedily and efficiently.
References
[1] Best, D. M., Endert, A., & Kidwell, D. (2014). 7 key challenges for visualization in cyber network defense. Proceedings of the Eleventh Workshop on Visualization for Cyber Security. 33–40. https://doi.org/10.1145/2671491.2671497
[2] Gutzwiller, R.S., Fugate, S., Sawyer, B.D., & Hancock, P.A. (2015). The Human Factors of Cyber Security Network Defense. Proceedings of the Human Factors and Ergonomics Society Annual Meeting, 59(1). 322-326. https://doi.org/10.1177%2F1541931215591067
[3] Mansman, F., Meier, L., & Keim, D.A. (2007). Visualization of Host Behavior for Network Security. In Goodall, J.R., Conti, G., Ma, KL. (Eds.) VizSEC 2007. Mathematics and Visyalization. 187 -202. Springer, Berlin, Heidelberg. https://doi.org/10.1007/978-3-540-78243-8_13
[4] Seong, Y., Nuamah, J., & Yi, S. (2020). Guidelines for cybersecurity visualization design. Proceedings of the 24th Symposium on International Database Engineering & Applications. 1-6. https://doi.org/10.1145/3410566.3410606
[5] Shiravi, H., Shiravi, A., & Ghorbani, A. A. (2012). A Survey of Visualization Systems for Network Security. IEEE Transactions on Visualization and Computer Graphics, 18(8), 1313–1329. https://doi.org/10.1109/tvcg.2011.144

