Taxonomy of GIS systems for industrial applications
Industrial equipment will in most cases have a strong connection to the real world. It has a defined shape, some sort of geographic location and has one or more defined usages. In our projects we are seeing bodies of supply pits, shore power units, grids, battery packs, charging stations and so forth. Each of these devices are designed to work in the real world for operation and usage by humans. These surfaces of interaction in the real world often take place with HMI (human machine interface) by direct interaction or through “proxy” by networked nearby mobile devices or in a control center context.

Figure: HMI interface
Through our work with customers we have developed our own language (or taxonomy if you will) for representing and interacting with industrial equipment. We can - and do - provide classical and standardized web interfaces for the more administrative tasks and interactions such as configuration management and rare administrative tasks. I.e tasks you might do once, maybe twice during the lifetime of a piece of equipment.
What we might do differently is to bridge and contextualize the interaction with these tangible and substantial artifacts through the use of GIS (geographic information systems). The taxonomy we now present has a specific purpose of providing the user with:
- System status at a glance
- Interaction with industrial devices
- Real time operation and manipulation
The taxonomy
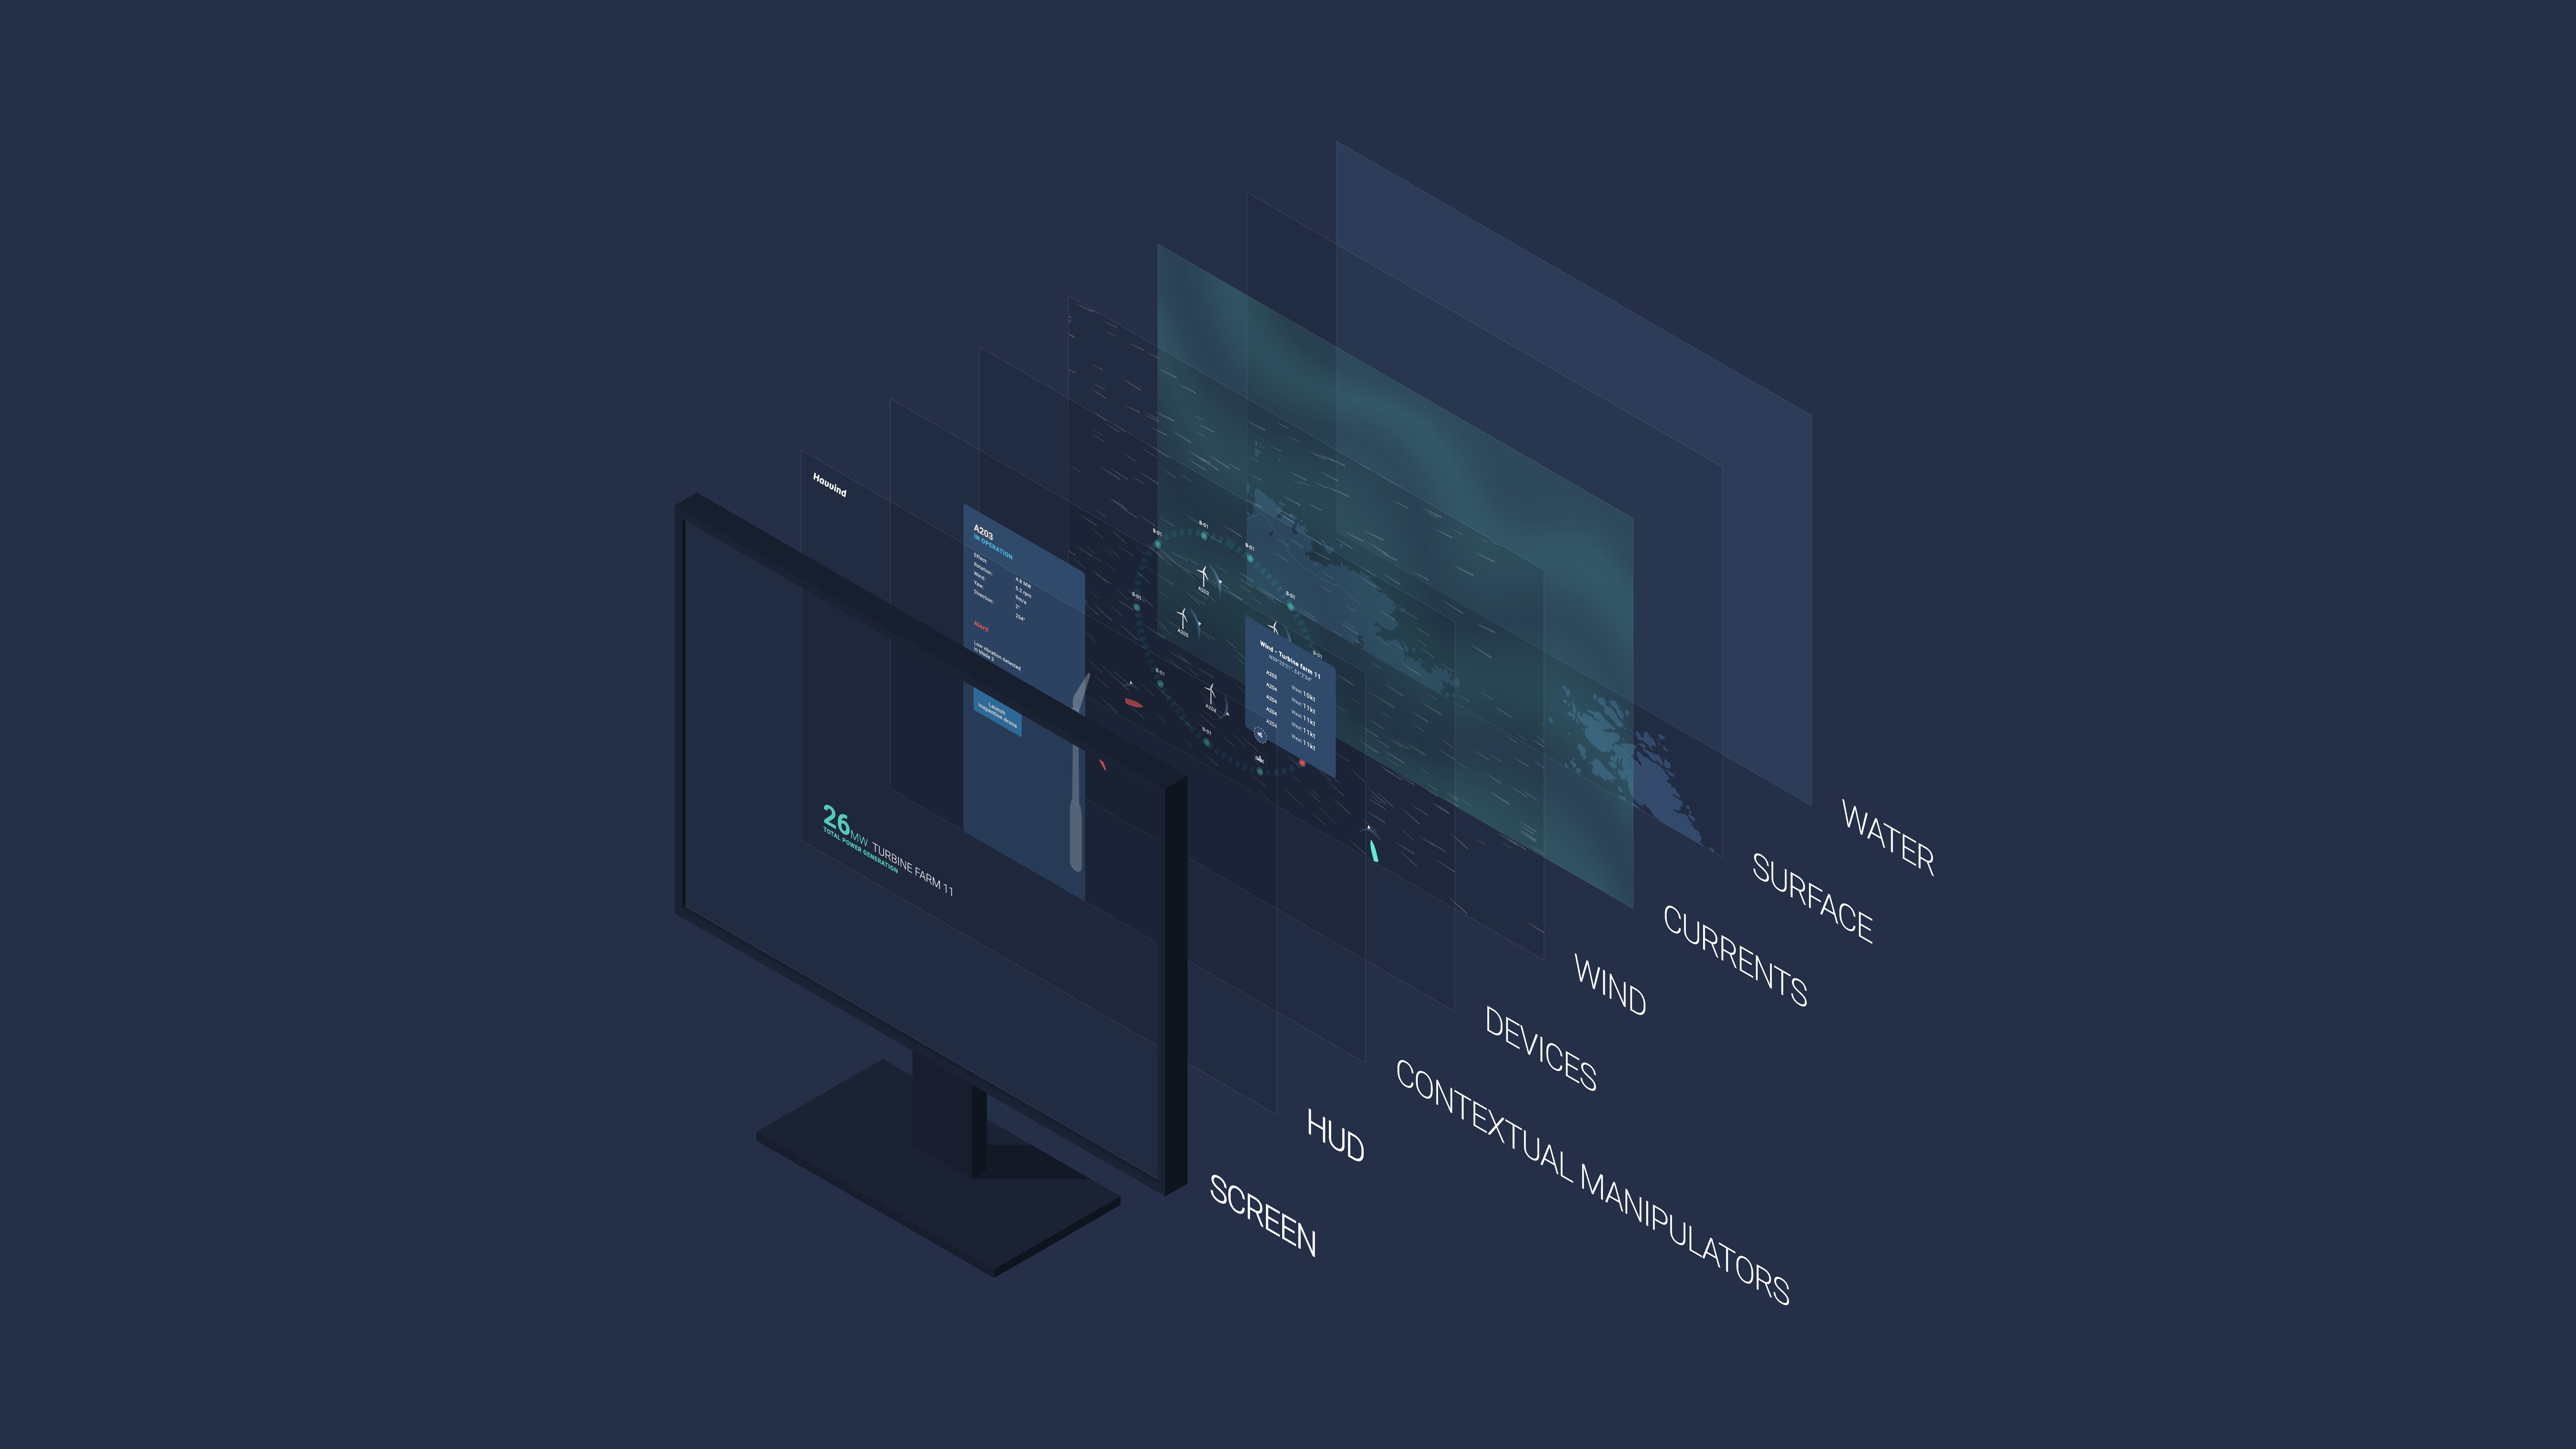
We break down our approach to interacting through GIS in a layer-based representation. A geographic representation (map), contextualized geographic datalayers, devices themselves, contextual manipulators, heads up display (HUD), device, and finally user.
.png")
Figure: The taxonomy
The map is the first layer of the visual representation. It contains the geographic information and situation for contextualizing and anchoring the following layers.
Maps
The map is the first layer of the visual representation. It contains the geographic information and situation for contextualizing and anchoring the following layers.
Datalayers
In the datalayers we can visualize any geo related information. This can be relevant weather data, traffic, infrastructure. However, this layer is intended for consumption and decision support to understand the next layers in detail, rather than interacting in detail.
Devices / interactive elements
The devices layer provides access to interacting with IoT devices (supply pits), nearby relevant entities such as vessels or drones.
Contextual manipulators
The contextual manipulators arise from the interaction with devices and interactive elements. Windows and widgets surface to provide the user with interaction possibilities such as turning on and off, adjusting values or providing information that support decisions.
HUD
The hud itself is a fixed view attached to the visualization view providing the user with general and overall information. Condensed summarizable information to provide a broader context and entrypoint for inspection.
Screen/Device
The screen space where the layers are interactable also plays a part into our considerations. Map interaction is by nature different on mobiles, tablets, desktops, control centers and even VR headsets. Different surfaces of interaction provide different avenues of interaction with the data and information.
User
The user is the final piece of the puzzle. Where a user is, how a user works and their needs are crucial to understanding and employing a geographical information system. Data and information seldom is constrained and understood alone. How the user collaborates, understands and engages with the representation is one of the most important aspects of user experience design.
Concluding remarks
With this taxonomy as a foundation for developing industrial internet of things geographical information systems we accomplish the following effects:
- An established framework enables us to structure visualization and interaction
- We provide users and businesses with value quickly
- Enable decision support and situational awareness in a map context
- Provide an easy to use and flexible way of working with IoT devices